

Focal lengths covered: 1.5″ / 2″ / 2.5″ / 4″
This article provides a theoretical comparison of four CO₂ laser focusing lens focal lengths, focusing on three key optical parameters: focused spot diameter, Rayleigh length, and defocus tolerance.
Comparing the Optical Performance of Four Focal Lengths
To make a consistent comparison, all four lenses are evaluated under the same incoming beam conditions.
|
Parameter |
Assumed value |
|
Laser wavelength, λ |
10.6 μm |
|
Incoming beam diameter, D |
6.0 mm |
|
Beam quality factor, M² |
1.2 |
|
Incoming beam condition |
Approximately collimated, near-Gaussian |
The incoming beam diameter is defined as the 1/e² beam diameter at the lens. The calculations assume an ideal thin lens and do not account for aberrations, aperture clipping, thermal effects, or manufacturing tolerances.
The M² value of 1.2 is an assumption used for this example. It does not represent measured performance of an SPT product.
1. Focused Spot Diameter and Rayleigh Length
|
Focal length |
Focused spot diameter, d₀ |
Rayleigh length, zR |
Full 2zR range |
|
1.5″ (38.1 mm) |
102.8 μm |
0.653 mm |
1.306 mm |
|
2″ (50.8 mm) |
137.1 μm |
1.161 mm |
2.322 mm |
|
2.5″ (63.5 mm) |
171.4 μm |
1.814 mm |
3.628 mm |
|
4″ (101.6 mm) |
274.2 μm |
4.644 mm |
9.288 mm |
Focused Spot Diameter by Focal Length
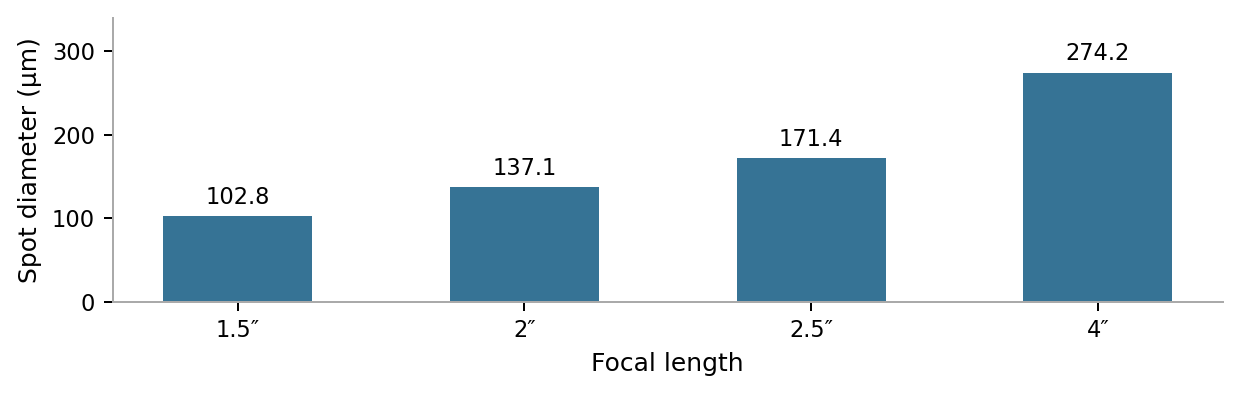
Calculated values in μm, using the same incoming beam conditions for all four lenses.
Full 2zR Range by Focal Length
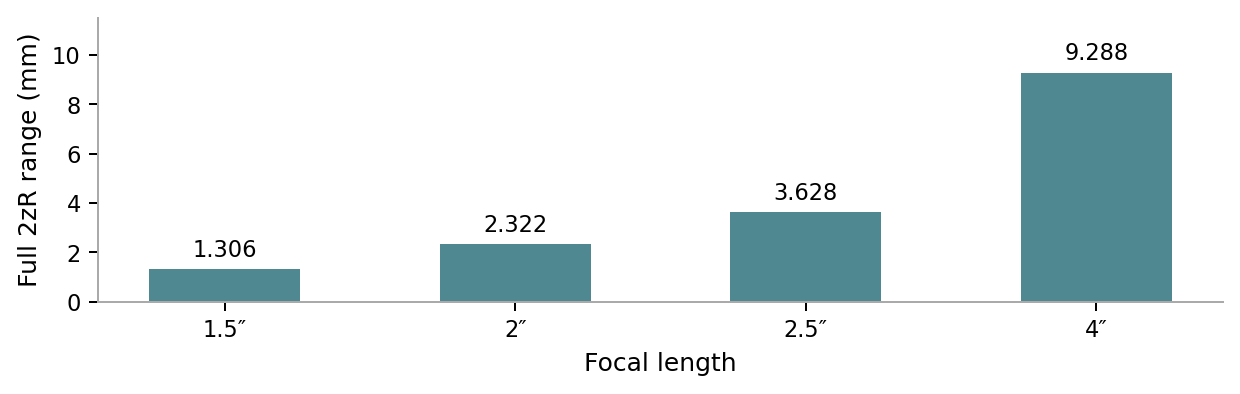
Calculated values in mm, using the same incoming beam conditions for all four lenses. These values do not represent experimentally verified processing depth of focus.
2. Defocus Tolerance: Using More Practical Criteria
Defocus tolerance needs to be evaluated against a clearly defined optical or processing criterion. The following table uses two consistent criteria:
1. The spot diameter increases by no more than 10% compared with its diameter at the beam waist.
2. The peak power density of a near-Gaussian beam remains at or above 80% of its value at the beam waist.
|
Focal length |
Axial range: spot diameter increase ≤10% |
Axial range: peak power density ≥80% |
|
1.5″ |
±0.299 mm |
±0.327 mm |
|
2″ |
±0.532 mm |
±0.580 mm |
|
2.5″ |
±0.831 mm |
±0.907 mm |
|
4″ |
±2.128 mm |
±2.322 mm |
All ranges are measured in both directions from the ideal beam waist. The peak power density criterion assumes a near-Gaussian beam profile.
Conclusion
When the incoming beam diameter, M², and wavelength remain the same, the focused spot diameter is approximately proportional to the focal length. The Rayleigh length, meanwhile, is approximately proportional to the square of the focal length.
In this example, the theoretical spot diameter of the 4-inch lens is approximately 2.67 times that of the 1.5-inch lens, while its Rayleigh length is approximately 7.11 times that of the 1.5-inch lens.
A longer focal length alone does not necessarily mean better cutting performance. Likewise, the full 2zR range should not be presented as the maximum effective cutting thickness of a material. Actual cutting quality must be verified through material and process testing.